



htop is a free, interactive process viewer. It shows what's running on your server and how much CPU and memory each process is using, updated live. It's one of the first tools to reach for when a server feels slow or runs low on memory.
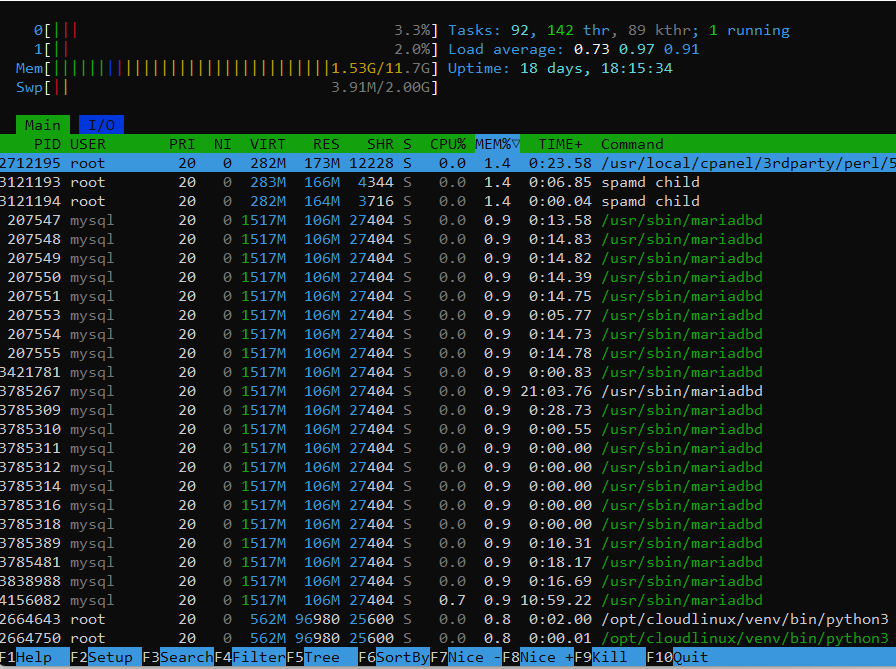
htop works on every operating system we offer: Ubuntu 22.04, 24.04 and 26.04, Debian 12 and 13, AlmaLinux 8, 9 and 10, and Rocky Linux 9 and 10.
Before you start
- SSH access as root or as a user with sudo rights. If you're logged in as root, you can leave
sudooff the commands. - htop uses very little memory, so it's fine on any VPS size.
Step 1: Install htop
Ubuntu/Debian
sudo apt update
sudo apt install -y htop
AlmaLinux/Rocky (htop comes from the EPEL repository):
sudo dnf install -y epel-release
sudo dnf install -y htop
Step 2: Run htop
htopRun it as your normal user to see everything. Use sudo htop if you want to stop (kill) processes owned by other users or by the system.
Reading the screen
The top section shows the overall state of your server:
- CPU bars: one bar per CPU core. Green is normal programs, red is the system (kernel), and blue is low-priority work.
- Mem: memory in use. Green is used by programs, while blue and yellow are buffers and cache, which Linux frees up automatically when programs need it.
- Swp: swap in use. A little is normal. A lot means the server is short on RAM.
- Load average: how busy the server has been over the last 1, 5 and 15 minutes. As a rule of thumb, a load higher than your number of CPU cores means work is queuing up.
- Uptime: how long since the server was last restarted.
The process list shows each running program. The most useful columns are:
- USER: who the process runs as
- RES: how much RAM the process is actually using
- CPU% and MEM%: its share of CPU and memory
- TIME+: total CPU time it has used
- Command: the program and its options
Useful keys
- Up / Down arrows: select a process
- P: sort by CPU use
- M: sort by memory use
- F6: choose another column to sort by
- F3 or /: search for a process by name
- F4 or \: filter the list, for example type
phpto show only PHP processes - u: show only processes for one user
- F5 or t: tree view, showing which processes started which
- F9 or k: stop (kill) the selected process. Choose 15 SIGTERM to ask it to close cleanly, or 9 SIGKILL to force it if it won't.
- F2: setup, to change colours, meters and columns
- F1 or h: help
- F10 or q: quit
If your SSH app doesn't send the F keys properly, use the letter shortcuts instead. You can also click on processes, column headings and the menu along the bottom with your mouse.
Tips for finding problems
- Server feels slow: press P to sort by CPU and see which process is at the top.
- Running out of memory: press M to sort by memory and check the RES column. If swap keeps growing, a process may be using too much, or your VPS may need more RAM.
- Something is using CPU but you don't know what: press F5 for tree view to see which service it belongs to.
Want more detail?
If you'd also like to see disk and network usage on the same screen, try btop. See our guide: Install btop to monitor resources.
Troubleshooting
- "No match for argument: htop" on AlmaLinux/Rocky: the EPEL repository isn't enabled. Run
sudo dnf install -y epel-releasefirst, then try again. - F keys don't work: use the letter shortcuts above, or check your SSH app's keyboard settings. In PuTTY, go to Terminal → Keyboard and set the function keys to Xterm R6.
- You can't kill a process: it may belong to another user or the system. Quit, then run
sudo htop.
Need help?
Our Cloud VPS plans are self-managed, so you're responsible for installing, securing and maintaining the software on your server. If something on our side isn't working, such as the network, or your VPS won't boot, open a support ticket. New to your VPS? Start with our Cloud VPS Getting Started Guide.
